Whether building a spreadsheet for yourself or developing a data integration for your organization, use this documentation to ensure your data is successfully imported into Spendlab.
For other topics, refer to the main Reference Guide.
Use a template as a starting point for importing data into Spendlab.
Spreadsheet format: Open this file with a spreadsheet program (such as Excel, Google Sheets, or Numbers) and copy/paste from there into Spendlab.
Directly importable format: These data files in CSV format can be dragged and dropped directly into Spendlab to import data.
Read on for more details about importing and formatting your data.
Spendlab can either create a new file or update an existing file in response to data you import.
Create a new budget: If you import data when Spendlab is showing the welcome screen with no budget file open, it will create a new budget file and populate it with the imported data.
Update an existing budget: If you import data when a budget file is already open, Spendlab will use the imported data to update that existing file.
When updating an existing file, Spendlab will:
There are three ways to get your data into Spendlab:
Toolbar Menu — Choose File > Import Data... to open the import dialog. From there you can paste CSV data or choose a .csv file from your computer.
Copy & paste — Select rows and columns in your spreadsheet (Excel, Google Sheets, Numbers, etc.), copy them, and paste directly into Spendlab. The app will detect tabular data and attempt to import it automatically.
Drag & drop — Drag a .csv file from your desktop or file browser and drop it onto the Spendlab window. The import process will automatically begin.
Note that you cannot drag and drop a .xls or .xlsx file directly into Spendlab. You must either copy and paste from the spreadsheet or save it as a .csv file before importing.
Spendlab imports data from one or more tables formatted as follows.
CSV format: The data must be formatted as plain text with table cells separated by a standard delimiter (comma, tab, pipe, semicolon, or ASCII code 30 or 31). If you copy and paste from a spreadsheet, this format will usually be generated automatically.
Table headers: The first row of a table must contain column headers. The columns can be in any order (with some exceptions described below), but each column must be one of the column types that Spendlab recognizes.
Table separators: If you import more than one table at a time, each table must be separated from other tables by a row that only contains one or more hyphens (or any dash-like character). See the templates for examples.
Blank rows: Empty rows are ignored by the importer.
Comments: Rows that start with a "#" sign (pound/hash symbol) are treated as comments and are ignored by the importer.
In this documentation, we display tables in spreadsheet format for ease of reading. However, if you are creating a data pipeline or script, you should output the plain text representation (CSV format).
| Funding source | Attribute | Value | Period Start |
|---|---|---|---|
| NIH grant | Balance including indirects | $292,695 | 2025-07-01 |
| DOE grant | Balance including indirects | $110,638 | 2025-07-01 |
Table represented as plain text (comma-separated values):
Funding source,Attribute,Value,Period Start
NIH grant,Balance including indirects,292695,2025-07-01
DOE grant,Balance including indirects,110638,2025-07-01
Most spreadsheet programs automatically create the plain-text format when you copy cells, so you can directly copy and paste into Spendlab.
"Period Start", "period start", "PERIOD START""PeriodStart", "Period Star", "Start Of Period"."$50,000" and "¥50,000" are both equivalent to "50000"."54.3%" rather than "0.543". The percent sign "%" is optional but recommended."2025-12-01" (ISO 8601) or "Dec 1, 2025" (US-en date format)."true"/"false" and "yes"/"no" with any mix of upper or lower case.| Category | Name | Period Start | Period End | Attribute | Value | Recurring Interval | Funding Source |
|---|---|---|---|---|---|---|---|
| Supplies | NIH project | 2024-09-01 | 2025-09-01 | Total direct costs | $4,300 | per month | NIH grant |
| Supplies | NIH project | 2025-09-01 | 2026-09-01 | Total direct costs | $3,800 | per month | NIH grant |
Spendlab recognizes the following data columns. They can be in any order.
The name of the budget section that will be imported into. (For example: "Funding sources", "People", "Travel".)
Matching is not case-sensitive, and any whitespace is trimmed. For example, " SUPPLIES " will match an existing section named "Supplies".
If no section with this name exists, a new section will be created.
The following keywords have special meaning when used in the Category column:
The name of the Spendlab row that will be imported into. (For example: "NIH grant", "Jane Doe", "Conferences".)
The importer looks for exact matches and then partial matches. For example, "NIH grant" and "304-551" will both match an existing funding source named "NIH grant (304-551)".
Matching is not case-sensitive, and any whitespace is trimmed. For example, " NIH GRANT " will match an existing funding source named "NIH grant".
If no matches are found within the specified Category, a new row will be created with the provided Name.
Specifies what property of the row to set. (For example: "Balance including indirects", "Salary", "Total direct costs".) Each type of row has its own set of valid attributes; see the Attributes Reference for a complete list.
The number, date, or text value to set for the specified Attribute. (For example: "$50,000", "25%", "2025-07-01", "false".) See the Value Formatting section for more details.
The start date for the data entry. (For example: "2025-07-01", "Jul 1, 2025".) For values that span a time range, use in conjunction with Period End. For one-time values, only Period Start is required.
The end date for the data entry. (For example: "2026-07-01", "Jul 1, 2026".) Used in conjunction with Period Start to define a date range for expenses, effort blocks, or funding installments.
"June 30, 2026") or the first day of the next period (e.g., "July 1, 2026").Specifies how to interpret the Value over the time period from Period Start to Period End. Valid options:
none (default) — Value represents the total amount with no repeatsyear — Value represents the annual amountquarter — Value represents the quarterly amountmonth — Value represents the monthly amounthalf month — Value represents the amount per half-month periodtwo weeks — Value represents the biweekly amountFor example, if Value is "$1,000", Recurring Interval is "month", and the time period spans 3 months, the total expense will be $3,000. If instead the Recurring Interval is omitted or "none", the total expense over the 3-month period will be $1,000, spread evenly over the 3 months as $333.33 per month.
The name of the funding source from which the expense or salary is paid. (For example: "NIH grant".) Must match the Name of an existing or concurrently imported funding source row. If omitted, the item is imported with an "unassigned" funding source to be manually allocated later.
For rows with split funding, use multiple data rows with the Split attribute to specify the percentage from each source. (See the templates for examples.)
Each Spendlab object has an associated set of attributes. Each attribute expects certain values to be included in the data import row.
Constant attributes require a Value in the data import row.
| Category | Name | Attribute | Value |
|---|---|---|---|
| Funding source | NIH grant | Indirect rate | 55.3% |
| Funding source | NIH grant | Color | Light Purple |
Time series attributes require at least a Value and Period Start in the data import row.
| Category | Name | Attribute | Value | Period Start | Period End |
|---|---|---|---|---|---|
| Funding source | NIH grant | Total including indirects | $388,828 | 2025-08-01 | 2026-08-01 |
| Supplies | NIH grant | Total direct costs | $50,000 | 2025-08-01 | 2026-08-01 |
See the templates for more examples in context.
Most attributes are optional and will fall back to default values if omitted.
Attributes listed below are constant unless "Time Series" is specified.
"month" (default), "half month", or "two weeks" (or "biweekly")."two weeks" (or "biweekly"), also provide a value for Time step base."$", "€", "£".0% or left undefined.0% or left undefined."54.5%") — Sets a constant indirect rate for the funding source."Federal indirect rate") — Links the indirect rate to a rate definition by name. This is useful when the indirect rate changes over time or is shared across multiple funding sources."none", "ignore", "n/a", "na", and "null" are equivalent to "0%".true (or yes) to carry remaining balances forward until the end date.false (or no) to reset the balance at each funding period boundary."Blue", "Green", "Orange", "Purple", "Brown", "Light Blue", "Light Green", "Light Brown", "Light Purple", "Teal", "Light Teal", "Plum", "Pink".Externally managed funding sources are used only for allocating effort in Spendlab. They have no configurable attributes.
year, month, two weeks, or hour. (The default is year.)yes for Other and no for Tuition.100% means full-time and 50% means half-time.
100%.yes (or true) to specify that indirect costs apply to this expense row.no (or false) to exempt the expense.yes, except for rows in the Equipment category (where the default is no).3% means each year's value will be 3% higher than the previous year.yes (or true) to specify that indirect costs apply to this expense row.no (or false) to exempt the expense.yes, except for rows in the Equipment category (where the default is no).Spendlab supports alternative column types and layouts that can make data tables more compact and easier to use in spreadsheets.
The examples in this section show alternative layouts for this data table:
| Category | Name | Attribute | Value | Funding source | Period start | Period end | Recurring Interval |
|---|---|---|---|---|---|---|---|
| People | Anna | Split | 40% | NIH grant | 2025-01-01 | 2025-02-01 | |
| People | Anna | Split | 60% | DOE grant | 2025-01-01 | 2025-02-01 | |
| People | Jose | Split | 100% | NIH grant | 2025-01-01 | 2025-02-01 |
Value, Period Start, and Period End columns can be replaced with date-labeled value columns. Each date header represents the Period Start for its column's values and the Period End for the previous date column (if any).
| Category | Name | Attribute | Funding source | 2025-01-01 | 2025-02-01 | 2025-03-01 |
|---|---|---|---|---|---|---|
| People | Anna | Split | NIH grant | 40% | 50% | |
| People | Anna | Split | DOE grant | 60% | 50% | |
| People | Jose | Split | NIH grant | 100% | 100% |
The Category and Name columns can be replaced with a single column with a header named for the category (e.g., People).
| People | Attribute | Value | Funding source | Period start | Period end |
|---|---|---|---|---|---|
| Anna | Split | 40% | NIH grant | 2025-01-01 | 2025-02-01 |
| Anna | Split | 60% | DOE grant | 2025-01-01 | 2025-02-01 |
| Jose | Split | 100% | NIH grant | 2025-01-01 | 2025-02-01 |
The Attribute and Value columns can be replaced with a single column with a header named for the attribute (e.g., Split).
| People | Split | Funding source | Period start | Period end |
|---|---|---|---|---|
| Anna | 40% | NIH grant | 2025-01-01 | 2025-02-01 |
| Anna | 60% | DOE grant | 2025-01-01 | 2025-02-01 |
| Jose | 100% | NIH grant | 2025-01-01 | 2025-02-01 |
You can add multiple attribute columns to a table if all the attributes have shared context (such as Category, Name, and Period start/Period end).
Columns can be left blank or omitted completely if they are not applicable to the type of data being imported.
| Category | Name | Attribute | Value | Funding source | Period start | Period end | Recurring Interval |
|---|---|---|---|---|---|---|---|
| People | Anna | Split | 40% | NIH grant | 2025-01-01 | 2025-02-01 | |
| People | Anna | Split | 60% | DOE grant | 2025-01-01 | 2025-02-01 | |
| People | Jose | Split | 100% | NIH grant | 2025-01-01 | 2025-02-01 |
These layout alternatives can be combined. For example, you can use both category headers and date headers in the same table for maximum compactness.
Use hyphen rows if importing multiple tables together. If you import more than one table at a time, each table must be separated from other tables by a row that only contains one or more hyphens (or any dash-like character). See the templates for examples.
Automatic defaults: If relevant cells are left blank (or a whole column is omitted), the importer will fall back to Spendlab's default values.
| People | Split | Funding source | Period start | Period end |
|---|---|---|---|---|
| Anna | 100% | NIH grant | 2025-01-01 | 2025-02-01 |
Non-applicable columns can be left blank or omitted completely if they are not relevant to the type of data being imported.
| Category | Name | Attribute | Value | Period Start | Period End | Recurring Interval | Funding Source |
|---|---|---|---|---|---|---|---|
| Funding source | NIH grant | Balance including indirects | 292,695 | 2025-01-01 | |||
| Balance including indirects | 243,695 | 2025-04-01 |
Inferred Category and Name: If the Category or Name value(s) are left blank on a data row, the importer will use the nearest preceding non-blank value.
| Category | Name | Split | Funding source | Period start | Period end |
|---|---|---|---|---|---|
| People | Anna | 40% | NIH grant | 2025-01-01 | 2025-02-01 |
| 60% | DOE grant | 2025-01-01 | 2025-02-01 | ||
| Jose | 50% | NIH grant | 2025-01-01 | 2025-02-01 | |
| 50% | TA | 2025-01-01 | 2025-02-01 |
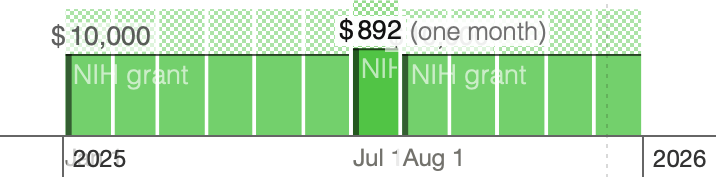
Data is imported sequentially, so later import lines override previous lines if they conflict.
If the conflicting lines use time periods that only partially overlap, later imports will adjust the overlapping period (creating new blocks if necessary), and leave non-overlapping time periods unchanged.
| Category | Funding source | Total direct costs | Period start | Period end |
|---|---|---|---|---|
| Supplies | NIH grant | $10,000 | 2025-01-01 | 2026-01-01 |
| Supplies | NIH grant | $892 | 2025-07-01 | 2025-08-01 |
Results in three time blocks: